Fake News: Modeling the Flow of Contradictory Accounts
Olivia B. Newton and Niclas Lovsjö
Introduction
In this paper, we describe a model developed at the Santa Fe Institute's Graduate Workshop in Computational Social Science. Specifically, we were tasked with modeling the flow of contradicting accounts about an event across a group. We interpret this scenario as information spread in a network. Based on this, we draw inspiration from two known phenomena: information cascades and herd behavior. Information cascades describe the spread of information and researchers have, for example, aimed to better understand the role of influential "spreaders" in networks (Jalili & Perc, 2017). Although both emphasize the sequence of individuals making a decision, some researchers distinguish between information cascades and herd behavior in terms of the private information held by individuals. In these descriptions, individuals engaging in herd behavior may take into account the private information they hold whereas indivdiuals in an information casecade ignore their privately-held information (Çelen & Kariv, 2004). In line with studies of information cascades, we contend that the individual who introduces the account into the network may play a critical role in determining the emergent pattern of information flow. Boundary spanners, as the name implies, serve as a bridge between groups and can thus facilitate the movement of ideas across a network (Shah et al., 2018). Boundary spanners are also oftentimes opinion leaders—that is, they are individuals are able to effectively influence the attitudes and opinions of others (Matous & Wang, 2019; Rogers, 2003). But new types of would-be opinion leaders have emerged with the rise of social media. In the relevant literature, these individuals are commonly referred to as "prosumers". Unlike boundary spanners, prosumers are not characterized by their position in a network or their ability to reach different audiences. Instead, prosumers are individuals who consume, distribute, and produce content to a relatively high degree compared to others in the network. Furthermore, prosumers tend to perceive themselves as opinion leaders but their peers may not (Weeks, Ardèvol-Abreu, & Gil de Zúñiga, 2017). In the following sections, we describe our model and results, in addition to potential applications and opportunities for future research.
Method
We used a network-based approach to model the flow of contradictory accounts about an event across a group. Our goal with this model was to better understand how (1) variations in account sources and (2) nodes' threshold to distort information can result in convergence and lead to the emergence of a "winning" account or a middle ground. Toward this end, we constructed a undirected lattice graph with some random addition of edges, in statistical computation software R (R Core Team, 2018). Contradictory accounts are introduced into the network from two distinct sources, and the nodes evaluate whether they will distort the information on the basis of its coherency with their beliefs before sharing it with their neighbors. The variations evaluated in our model are presented in Table 1. All nodes have an equal probability of being assigned particular belief when the model is intiialized (Table 2a). The degree to which nodes will distort the account value is also assigned at model intialization and is drawn from a uniform distribution between 0 and 0.25. In addition to this, two nodes-the account sources-are selected to recieve a particular account value (Table 2b). Nodes change their beliefs if they are sufficiently inconsistent with the average account value held by their neighbors. More specifically, the node subtracts the account value provided to them by their neighbor from their belief value to determine if it is greater than the threshold to distort. If the absolute value of the difference is greater than the threshold to distort, then the node changes the account value based on their distortion value. The direction in which the node distorts the value is based on the belief. In other words, if the belief is 1, then node distorts the account so that it is closer to 1.
| Account Sources |
|---|
| Boundary Spanner - Boundary Spanner |
| Regular Node - Regular Node |
| Boundary Spanner - Regular Node |
| Threshold to Distort |
|---|
| 0.25 |
| 0.5 |
| 0.75 |
| Belief Value |
|---|
| 0 |
| 1 |
| Account Value |
|---|
| 0.25 |
| 0.75 |
In the model, we assumed the following:
- the structure of the network remains unchanged over time (see Figure 1);
- nodes hold a set of beliefs that are relevant to the contradicting accounts;
- an node's beliefs can change over time;
- an account of an event is more or less coherent with an node's beliefs;
- nodes will distort an account if it conflicts with their beliefs;
- nodes will always decide to share account their neighbors;
- nodes will engage in bidirectional sharing of account.
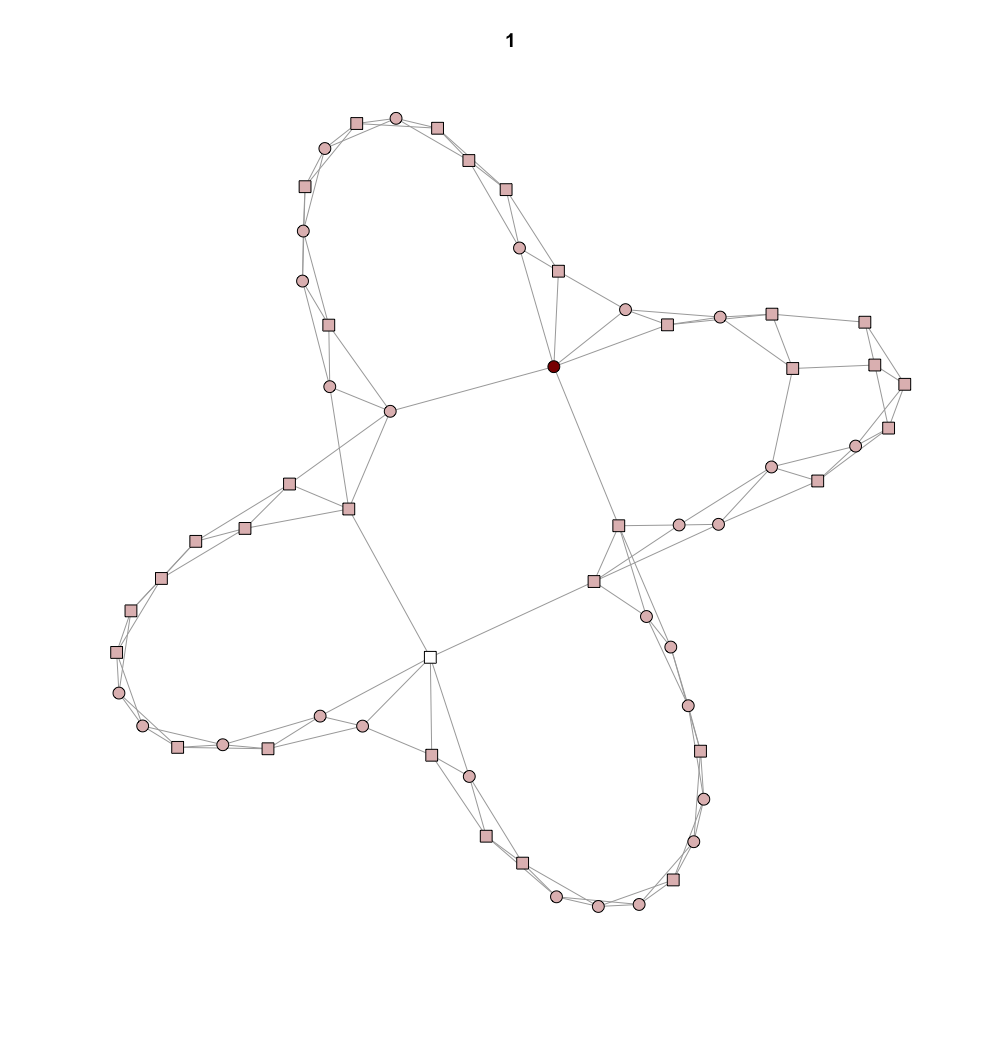
Figure 1: Network structure used to model flow of contradictory accounts across a group.
Results
The Process
There are two simultaneous interacting processes acting on this graph. On one hand, we have the belief system that is changing, and, on the other, the account value of the observed event.
The process starts off with a random initialization of the belief system. The neighborhoods that happen to have high similarity in terms of their belief systems will be resistant to changes from their opposing surrounding nodes. This means that there is an early transition from the random initialization into a locked-in state of clustered belief systems. Once these are settled they start to spread clock-wise through the lattice, as illustrated in Figure 2. The focal node sends out its account value to all its neighbors. This will not make a change to the neighbors with the same belief system and similar account values, i.e., the counter-clockwise nodes. Sending it ”forward” to the opposing neighbors will change the opposing neighbors' value closer to the value of the focal node. After these account-value-messages have been sent for each iteration, the nodes update their belief system. If the mean of the neighbors account values is less than or equal to 0.5 then the focal node will change its belief system to 0, and 1 if it is greater than 0.5. The process will stop when the belief-system process converges to either 0 or 1 for all the nodes. At this point, all nodes will simply accept their neighbors' account value and convergence happens.
Figure 2: Animation of belief (node shape) and account value (node color) change in network over time.
Outcomes
The plots in Figures 3-5 show the output of the simulations for each possible combination of Boundary Spanner - Boundary Spanner, Boundary Spanner - Regular Node, Regular Node - Regular Node for the threshold values of 0.25, 0.5 and 0.75 of distances between the account value and the belief system to choose to distort the account or adopt it as it is.
For threshold value of 0.25 we can see that convergence does not happen within 50 iterations, but that it asymptotically tends to convergence. An interesting pattern emerges here. For symmetry reasons, one would intuitively believe that having two boundary spanners or two regular nodes would be two end-points of a spectrum of fluctuations, with one boundary spanner and one regular node being in the middle. But as we can see the largest fluctuation happens when the accounts are introduced by one boundary spanner and one regular node. We speculate that this is due to a few reasons. Let us begin with noting that the starting amplitude is greatest for the slowest converging combination (i.e., the bottom plot in Figure 3). After this initial iteration, it slowly moves towards convergence. This indicates that the processes might be the same, just starting from different amplitudes. So why does the one boundary spanner and one regular node simulation start off with a greater differences in amplitude? We believe this is due to the low threshold to distort, such that regular node (starting off with an account value of either 0.25 or 0.75) is able to start influencing its neighbors (starting with an account value of 0.5) immediately. If the threshold to distort is higher, then the account value would not penetrate through the neighborhood from the regular node. Instead, the account value would become distorted towards its neighbors' beliefs resulting in values near the middle ground, rather than either of the two extremes (0 or 1).

Figure 3: Temporal changes in account value when threshold to distort is set to 0.25. The nodes fail to converge on an account in less than 50 iterations but presents less variability in account in the case of regular node-regular node account sources. Furthermore, the nodes distort the account towards one of the intially introduced accounts. We observe the greatest variability in account values over time when accounts are introduced by different node types.

Figure 4: Temporal changes in account value when threshold to distort is set to 0.5. In this case, the nodes converge on an account between approximately 20 and 30 iterations. Across initial account sources, the nodes converge to a middle ground. We observe the greatest fluctuation in accounts over time when they are intially introduced by similar nodes compared to when they are introduced by different types of nodes (i.e., one boundary spanner and one regular node).

Figure 5: Temporal changes in account value when threshold to distort is set to 0.75. Regardless of account source, the nodes quickly converge on an account value (less than 10 iterations). However, the direction of the distortion differs for each account source. Interestingly, when the accounts originate from two different sources (i.e., one boundary spanner and one regular node) the nodes converge to a value near the middle ground but when the accounts originate from similar sources the nodes converge to one account.
Discussion
The results of the model suggest that position of the nodes that introduce the accounts and the threshold to distort can produce differences in terms of the time to converge and the convergence to a particular account or a middle ground. Our model can be improved upon and extended in several ways. Future work can explore how differences in network structure can be used to produce different patterns of information flow. This includes both evaluations of dynamic networks and different networks (e.g., scale-free networks, random networks, etc.). In the model presented here, all nodes are governed by same belief change rule; nodes change their beliefs when the majority of their neighbors hold beliefs that differ from their own. The likelihood of individual to change their beliefs can be explored further, e.g., as a means to to increase the heteogeneity of the nodes in the network. Heterogenity of the nodes can also be increased by taking into account varying degrees of influence and their relation to virality, rather than focusing solely on two types of nodes. This model can be applied to study several scenarios of interest to social scientists, particularly in exploring differences in information cascades. In terms of more practical applications, this model can help researchers understand the emergence of new opinion leaders. For example, in the bottom plot of Figure 3, we see that the presence of regular node in combination with the low threshold to distort results in its ability to quickly spread its distorted account. Another clear application for this work is in the study of narrative and counter-narrative for the purposes of persuasion. Here, researchers can explore how the introduction of a counter-narrative at a particular network position and point in time can potentially override an existing narrative.
References
Çelen, B., & Kariv, S. (2004). Distinguishing informational cascades from herd behavior in the laboratory. American Economic Review, 94(3), 484–498. https://doi.org/10.1257/0002828041464461
Jalili, M., & Perc, M. (2017). Information cascades in complex networks. Journal of Complex Networks. https://doi.org/10.1093/comnet/cnx019
Matous, P., & Wang, P. (2019). External exposure, boundary-spanning, and opinion leadership in remote communities: A network experiment. Social Networks, 56, 10–22. https://doi.org/10.1016/j.socnet.2018.08.002
R Core Team. (2018). R: A Language and Environment for Statistical Computing. Vienna, Austria: R Foundation for Statistical Computing. https://www.R-project.org
Rogers, E. M. (2003). Diffusion of innovations (Fifth Edition). New York: Free Press.
Shah, N. P., Levin, D. Z., & Cross, R. (2018). Secondhand social capital: boundary spanning, secondhand closure, and individual performance. Social Networks, 52, 18–27. https://doi.org/10.1016/j.socnet.2017.04.005
Weeks, B. E., Ardèvol-Abreu, A., & Gil de Zúñiga, H. (2017). Online influence? Social media use, opinion leadership, and political persuasion. International Journal of Public Opinion Research, 29(2), 214–239. https://doi.org/10.1093/ijpor/edv050