Christos A
Ioannou And
Paul Smaldino
Graduate Workshop In Computational Social Science
June 17, 2008

Graduate Workshop In Computational Social Science
June 17, 2008
The Homework Problem:
People enter and leave an elevator as it travels up and down.
Model, using whatever techniques you wish, the above scenario.
Explicitly state your model and key assumptions.
Summarize key results.
Suggest some potentially interesting future directions and questions for the model.
Suggest some standard social science scenarios that could be usefully modeled using such a process.
Our Model:
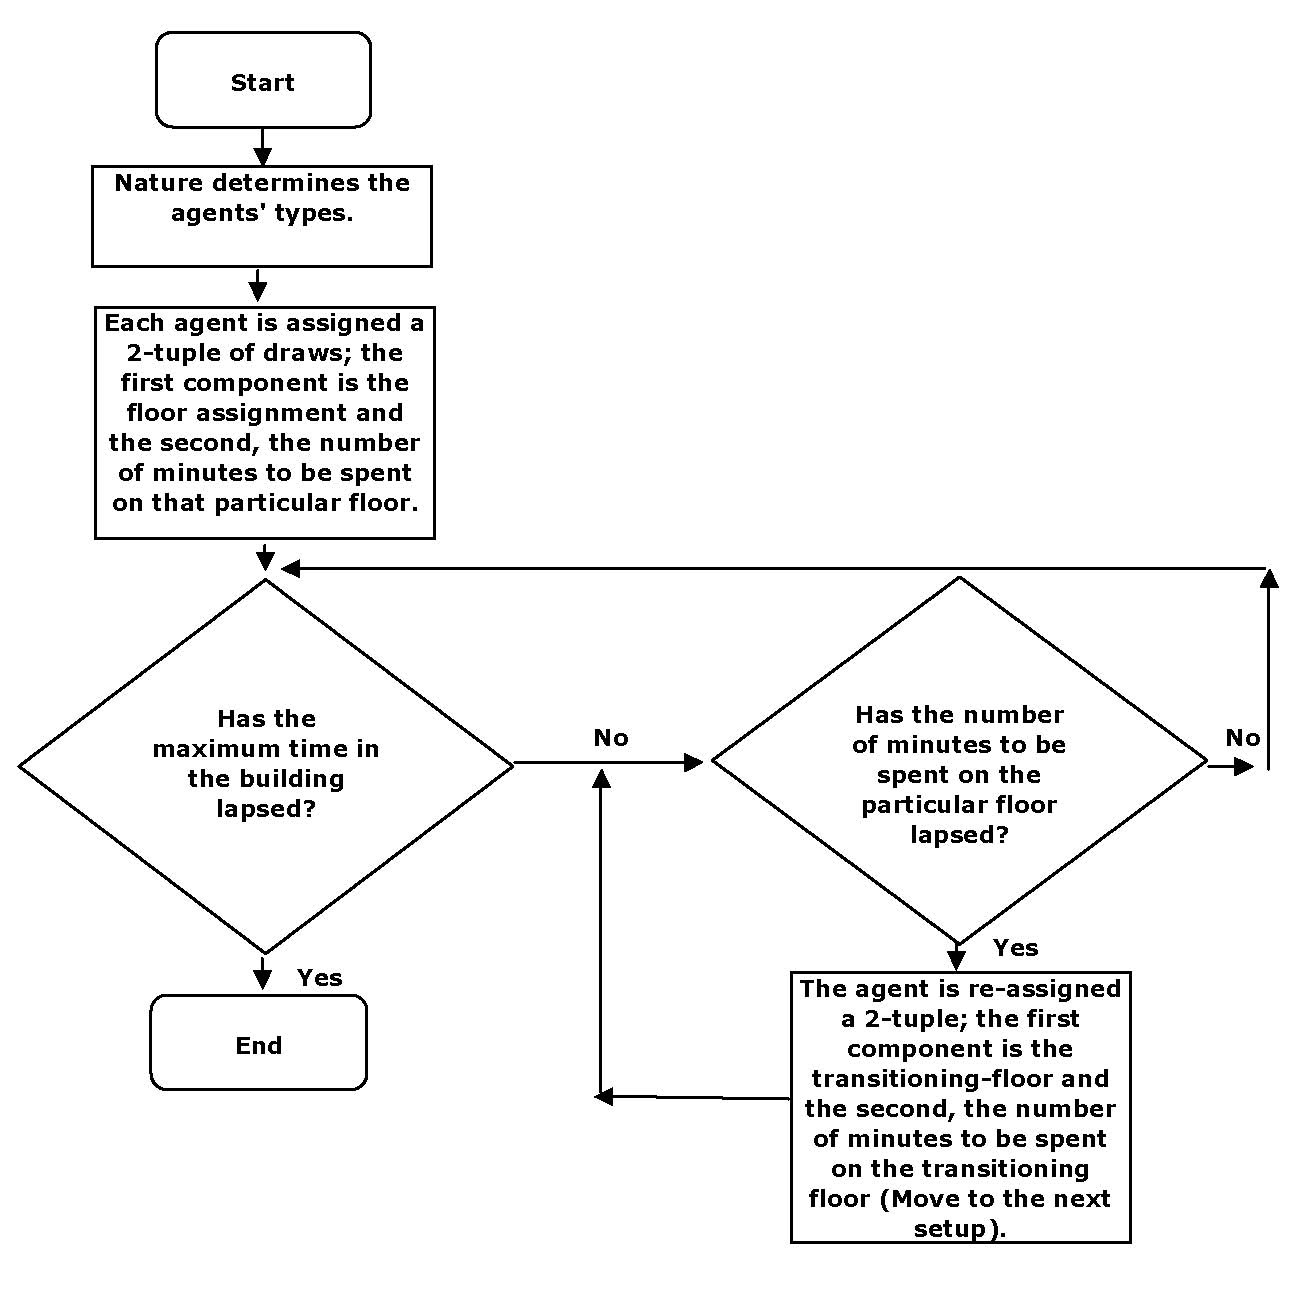
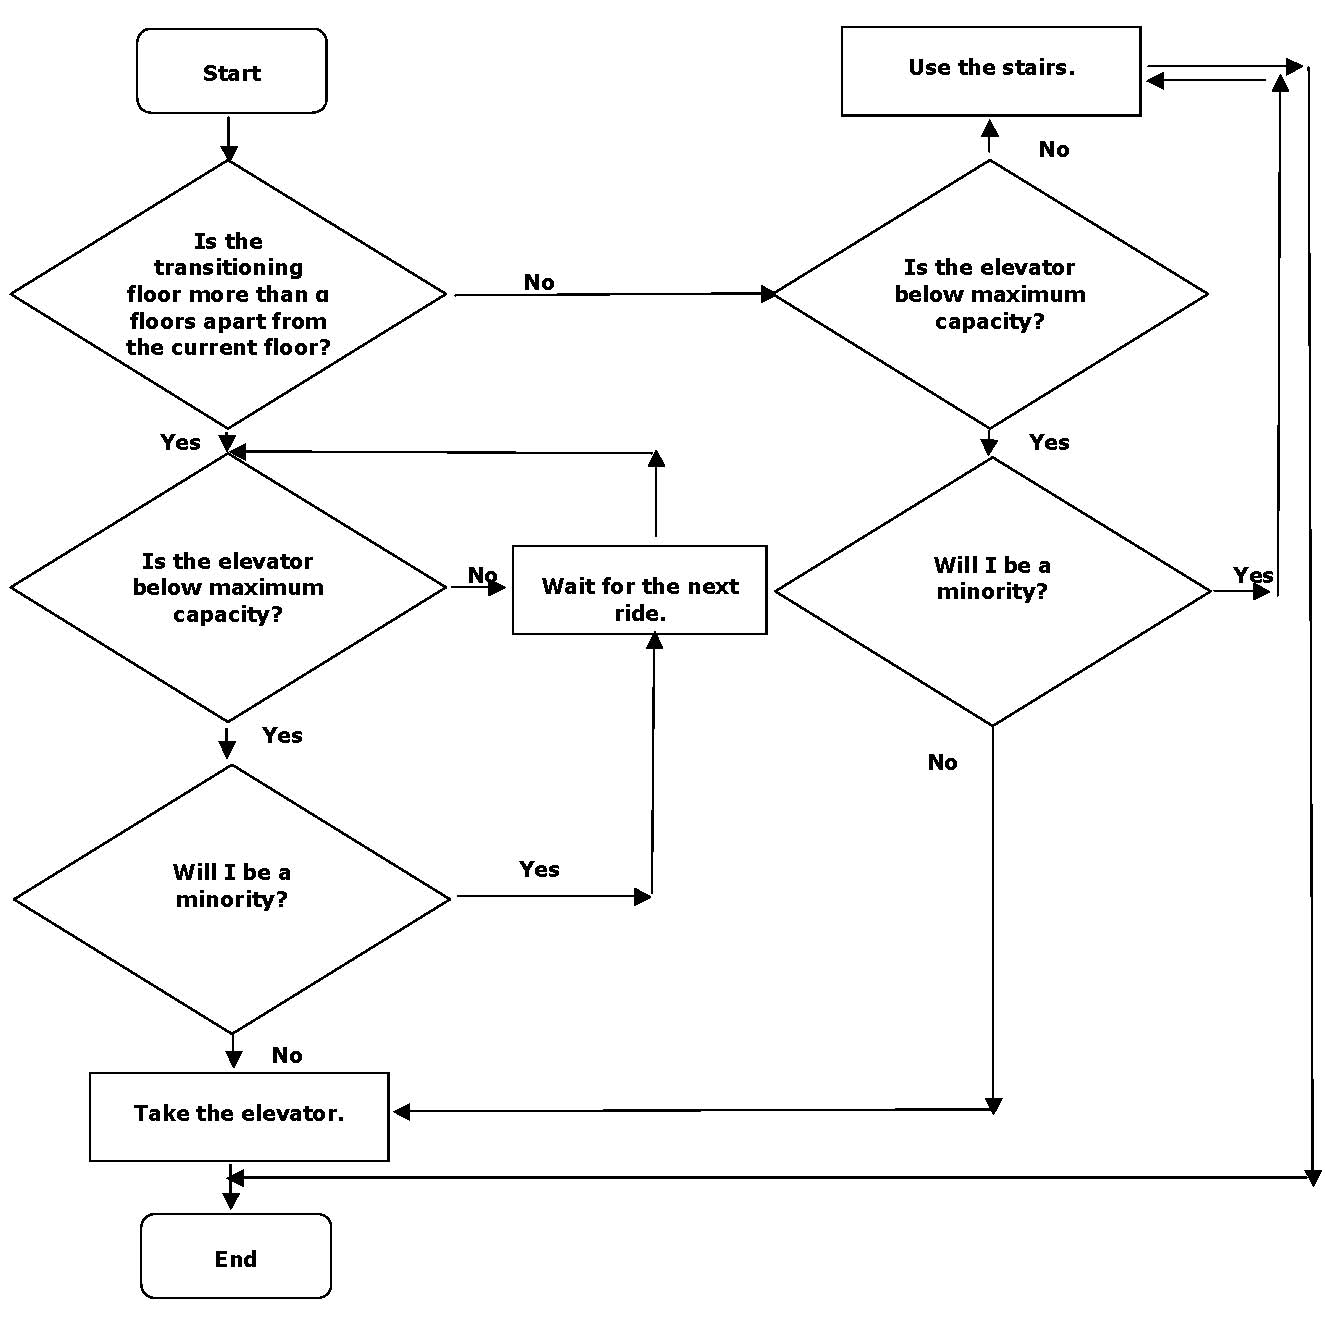
N agents are randomly assigned to a floor in our building. They are randomly assigned a timeto be spent on that floor, after which they head to the elevator. The elevator goes up and down, agents never leave or enter the building, but merely go from floor to floor. The elevator has a direction - e.g. when going up, it keeps going up if anyone on the elevator is heading to a higher floor or there is someone at a higher floor who has called the elevator. The elevator travels one floor per time step, and must pause on a floor for a time step when there is entering and/or exiting. Agents faced with a full elevator (or a majority of "weirdos" in some cases) can opt to take the stairs if their destination is not too many floors away. Taking the stairs takes 2 time steps per floor.
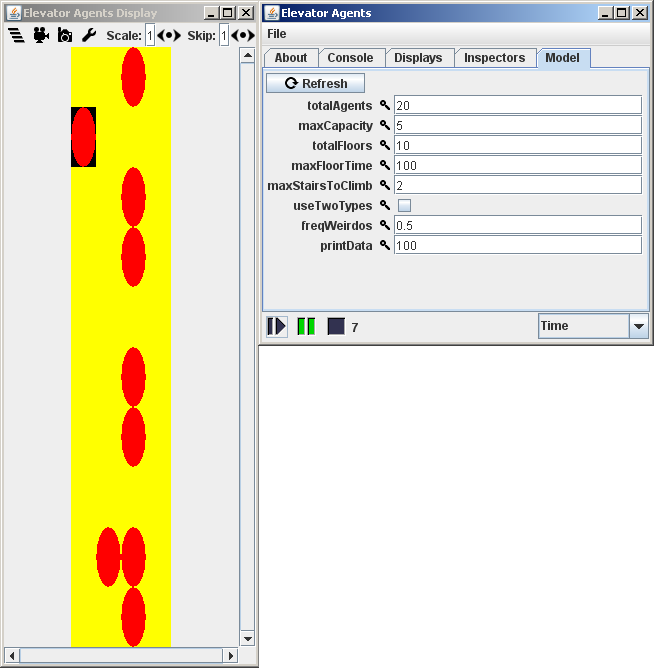
Here is a screen grab of the Java application.
There are rows, representing floors. There are four columns.
The left most is the elevator (the black square). The second is waiting for the elevator. The third is hanging out (not waiting) on a floor. The fourth is the stairwell.
The agents are the red circles.
And in motion:

Some Results (ala Comparative Statics):
| Primitives | Case# | 1 | 2 | 3 | 4 | 5 | 6 | 7 | 8 |
| Time In The
Building | 10,000 | 10,000 | 10,000 | 10,000 | 10,000 | 10,000 | 10,000 | 10,000 | |
| Agents | 5 | 20 | 20 | 20 | 200 | 200 | 200 | 200 | |
| Maximum Capacity | 2 | 2 | 5 | 5 | 5 | 5 | 5 | 5 | |
| | Floors | 10 | 10 | 10 | 10 | 10 | 20 | 20 | 20 |
| Maximum Floor
Time | 10 | 10 | 10 | 100 | 100 | 100 | 100 | 100 | |
| Maximum Stairs
Climbed | 2 | 2 | 2 | 2 | 2 | 2 | 2 | 5 | |
| Types | 1 | 1 | 1 | 1 | 1 | 1 | 2 | 1 | |
| | | | | | | | | | |
| Elevator
Riders/Time |
1.593 | 1.895 | 3.823 | 2.657 | 4.287 | 2.608 | 2.572 | 2.339 | |
| | | | | | | | | | |
| Total Waiting
Time/Agents |
4894.2 | 7978.25 | 5989.65 | 1469.8 | 7867.865 | 8862.845 | 8881.765 | 8587.8 | |
| | | | | | | | | | |
| Time Elevator
at Max Capacity | 4196 | 8525 | 6165 | 1162 | 9727 | 9652 | 9655 | 9652 | |
We ran the simulation and varied a number of parameters, each in turn.
These values represent the data from a single run for each of the set of parameter values, however, we ran a number of configurations 3 or 4 times, and the results were very similar. Therefore, we assume these data to be representative of the model's output.
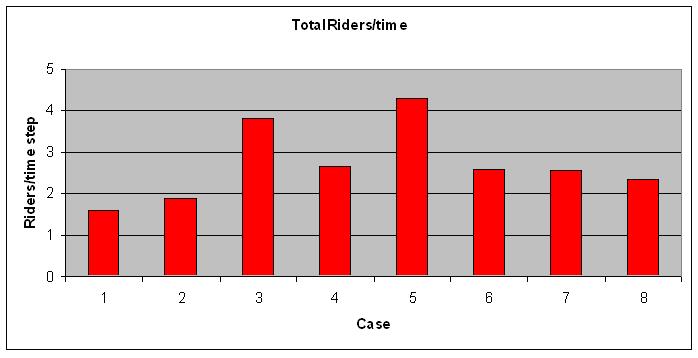
Average Number of Elevator Riders per Time Step:
Predictably, this tended to be lower when there were fewer agents. There is an obvious increase when the capacity of the elevator is increased, and again when the number of agents is increased. Increasing the amount of time spent of the floors also predictable lowered this statistic. Increasing the number of floors lowered the average number of riders, likely because agents were now traveling farther, and the elevator was at capacity for more stops.
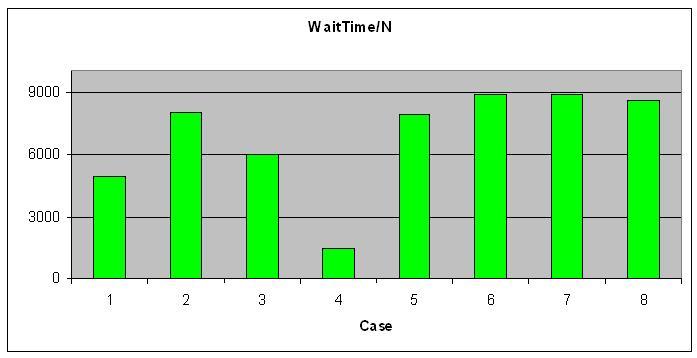
Average Wait Time:
This is the sum of the number of time steps each agent was waiting for the elevator, divided by the number of agents. We think this is an interesting statistic by which to measure elevator performance.
We see an increase when the number of agents jumps from 5 to 20, indicating that the role of the full-to-capacity elevator is coming into play. An increase in capacity helps to alleviate the average wait time, as does the amount of time spent on the floor (and therefore not on or waiting for the elevator).
Once the number of agents is increased to 200, the wait time goes up again. Further changes, such as increasing the number of floors, have a very small effect. It is likely that this is a ceiling effect - the elevator is so often full that most agents spend most of their time waiting.
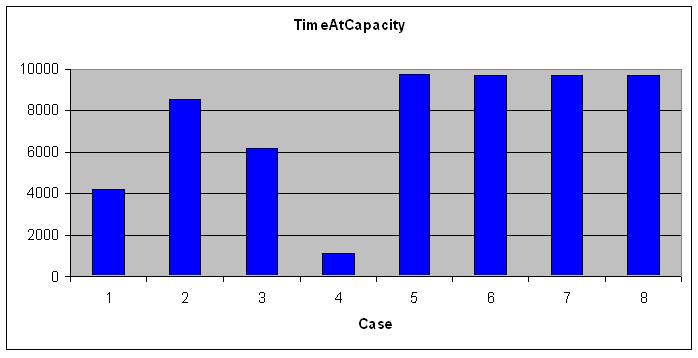
Time at Maximum Capacity:
This is the number of time steps in which the elevator is completely full. It is clearly very related to the average wait time, as the charts look very similar. Notice that once the population of the building is increased to 200 agents, the elevator is almost always full - over 96% of the time. Again, this is likely a ceiling effect. In order to reduce these last two statistics, we would recommend increasing the capacity of the elevator and/or increasing the average time spent on the floor. From the combination of the three charts, it appears that the elevator runs the most smoothly in Case 4, when there is ample time spent on the floor and a large capacity compared to the number of agents..
Allowing for two types to discriminate against one another did not seem to have any effect on the operation of the elevator. To insure this wasn't a result of a ceiling effect, we ran the simulation with two types with all the other parameters of Case 4, our most efficient case. It had no noticable effect on the data.
Stairs:
Increasing the maximum number of stairs an agent will walk from 2 to 5 during Case 4 did yield a small but likely significant decrease in both Wait Time and Time at Maximum Capacity.
- Instead of an agent simply calling the elevator, pressing the specific floor could aid optimization.
- Multiple elevators, perhaps with an assignment of floors such as those found in large buildings.
- Futher investigation of types & preferences. For example, imagine types who prefer crowded elevators.
- Allowing people to enter and leave the building, perhaps even on a daily cycle where everyone enters in the morning and leaves in the evening.
- Investigation of groups of agents who want to travel together.
- A more dynamic function for taking the stairs. Perhaps the longer an agent waits, the more stairs she is willing to climb.
- Reacting to crowds waiting for the elevator.
- Adaptive agents: learning what strategies or stairs and waiting works best.
- More probable patterns of travel. Most people will get on and off at ground floor. Further, in certain buildings, other floors are hotspots, and people from one floor might be more likely to go to another. E.g. in a department store, people getting on at Women's Shoes will be more likely to go to Cosmetics than people getting on at Men's Athletic Wear.
- Transportation: bus & train line traffic.
- With multiple elevators, interesting type preferences, & adaptive agents: the formation of social cliques.
- Emergence of selective migration - if a population adapted to an equilibrium by always or never taking the stairs.
Notes:
- The code was written in Java, using MASON's modeling libraries.
- Though the data appears to be stable, we recognize that in general forty simulations are required to apply the central limit theorem.
- This project was worked on at the 2008 SFI Graduate Workshop in Computational Social Science Modeling, housed at St. John's College in lovely Santa Fe, NM.